Mastering Exponential Decay in Golang: Insights and Visuals
Written on
Chapter 1: Understanding Exponential Decay
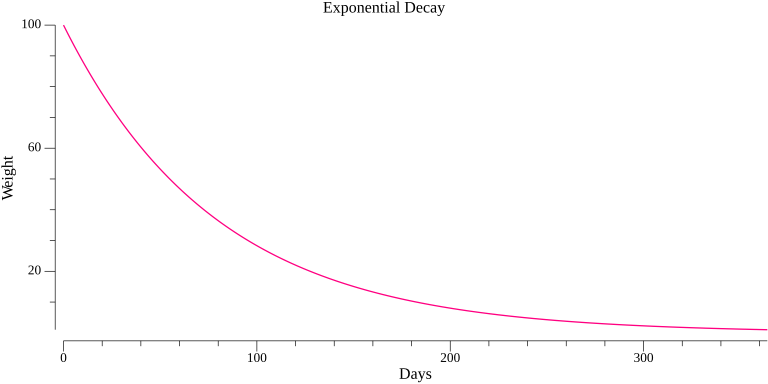
Exponential decay is a crucial concept with applications spanning various fields, including science and finance. It characterizes a process that diminishes at a rate that is proportional to its current value. This concept is particularly useful for emphasizing the significance of recent events, as their relevance diminishes over time.
One practical application of this concept involves assigning weights to observations based on their recency. More recent data points tend to be more pertinent and trustworthy, thus warranting a higher weight. An exponential decay function effectively fulfills this requirement, beginning with a significant weight that progressively decreases to a lower threshold as time advances.
In this article, we will explore how to implement an exponential decay function in Golang and visualize this decay using the Gonum/plot library.

Implementing Exponential Decay in Golang
The following code snippet demonstrates how to implement an exponential decay function in Golang:
package main
import (
"gonum.org/v1/plot"
"gonum.org/v1/plot/plotter"
"gonum.org/v1/plot/vg"
"image/color"
"log"
"math"
)
// calculateLambda computes the lambda value for the exponential decay function.
func calculateLambda(start float64, end float64, lifetime float64) float64 {
return math.Log(start/end) / lifetime
}
// calculateWeight computes the weight for the exponential decay function.
func calculateWeight(days float64, start float64, lambda float64) float64 {
return start * math.Exp(-lambda*days)
}
func main() {
start := 100.0
end := 1.0
lifetime := 365.0
lambda := calculateLambda(start, end, lifetime)
p := plot.New()
p.Title.Text = "Exponential Decay"
p.X.Label.Text = "Days"
p.Y.Label.Text = "Weight"
// Create a line plotter and set its style.
pts := make(plotter.XYs, int(lifetime))
// Calculate the weight for each day and add it to the plot.
for i := 0; i < int(lifetime); i++ {
pts[i].X = float64(i)
pts[i].Y = calculateWeight(float64(i), start, lambda)
}
line, _ := plotter.NewLine(pts)
line.LineStyle.Width = vg.Points(1)
line.LineStyle.Color = color.RGBA{R: 255, B: 128, A: 255}
p.Add(line)
err := p.Save(8*vg.Inch, 4*vg.Inch, "decay.png")
if err != nil {
log.Printf("Error: %s", err)
return
}
}
Key Calculations in Exponential Decay
The exponential decay function relies on two primary parameters: start and end, which represent the weights at the beginning and end of the decay period, respectively. A crucial aspect of this function is the lambda parameter, which dictates the decay rate. The lambda value can be calculated using the formula:
lambda = ln(start/end) / lifetime
In this formula, ln denotes the natural logarithm, while start, end, and lifetime are as defined earlier.
To find the weight on a specific day, we use the formula:
weight = start * e^(-lambda*days)
where e is the base of natural logarithms.
Visualizing Exponential Decay with Gonum
Gonum is a comprehensive set of numeric libraries for the Go programming language, providing tools for matrices, statistics, optimization, and more. The gonum.org/v1/plot package, in particular, allows for the creation and rendering of plots in Go applications.
To visualize exponential decay, we initiate a new plot with designated labels for the X and Y axes. For each day in the defined lifetime, we calculate the weight using our decay function and plot the results. After plotting all points, we customize the plot's appearance by adjusting the line's width and color. Finally, we save the plot as an image file through the Save method, specifying the desired dimensions and filename.

Applications of Exponential Decay
The implementation of exponential decay has a broad range of practical applications. For example, it can be utilized in time series analysis, where more recent data is weighted more heavily due to its relevance.
In customer analytics, for instance, recent customer interactions often provide better insights into current behaviors and preferences. Similarly, in finance, recent market events may have a more substantial impact on predicting future trends.
In summary, mastering the concept and implementation of exponential decay is crucial across many data-driven fields. With the capabilities offered by Golang and libraries like Gonum, we can efficiently conduct complex mathematical operations and visualize our data, leading to more precise and actionable insights.
Chapter 2: Learning with Video Resources
To further enhance your understanding of exponential decay and its visualizations in Golang, check out this informative video:
This video, titled "justforfunc #34: Plotting Data with gonum/plot (ML4G #1) - YouTube," provides valuable insights into plotting data using the Gonum library, complementing the concepts discussed in this article.